The math behind my Top 50 rankings I believe is a bit different than PSKreporter’s Top Monitors. Its not clear to me how and when PSKreporter comes up with their ranking numbers. I figured I’d write and advertise a system that has some explanation behind it and that people can hopefully understand and maybe help refine.
The goal of this system is to find and rank the best frequency hopping and simultaneous, multi-band, multi-mode skimming stations on a daily basis, similar to WSPR.rocks. These top performing, PSKr spotters I term “mega-spotters”. The system finds mega-spotters by looking across all PSKr spotter data for a given period. It tallies a spotter’s unique sender call/band pair spots while ignoring mode. For these rankings there is no emphasis on raw spot count aggregation. Nor is there emphasis on ranking a particular band for finding the top spotter on that band.
To be more specific, the ranking calculations credit a spotter one point as follows: if K1ABC spots K1HTV on 20m/FT8, 20m/FT4, 20m/CW, 20m/WSPR and 20m/JS8 during a period, they get credit for just one point. Unique call/band spots are tallied for all bands 2200m through 6m and aggregated into a combined total count by which spotters are ranked for the Top 50. The system does not credit a spotter for multiple mode spots of a Sender Callsign on a band, nor for being on the same band all day spotting the same station over and over again. There is still an incentive for a spotter to skim multiple modes as not everyone operates all modes. The system does have the ability to compare mega-spotters band by band, showing unique send call/band spot counts to find on what bands they excel.
This ranking system is not a real-time system, but it is updated every 6 hours and has a rolling 24 hour window for the Top 50. There are two Top 50 tables, one covering the last 24 hour period and one covering the last 6 hour period. I am pulling the compressed spot data (~400M) that is posted by PSKr’s system. The file server has data is public as seen below. This data uncompressed is roughly 3 GB and holds up to 40 million decodes every 6 hours.

Here is the Top 50 ranks page entry point where you will find the latest rankings posted every 6 hours as well as links to historical rankings. Drilling into a 6 hour page one will find both a past 24 hour Top 50 Rankings as seen below.
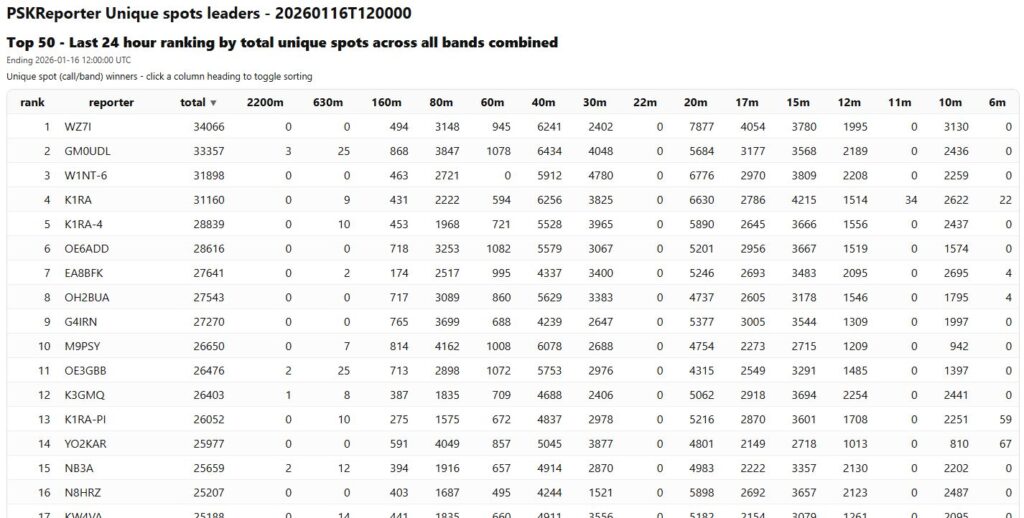
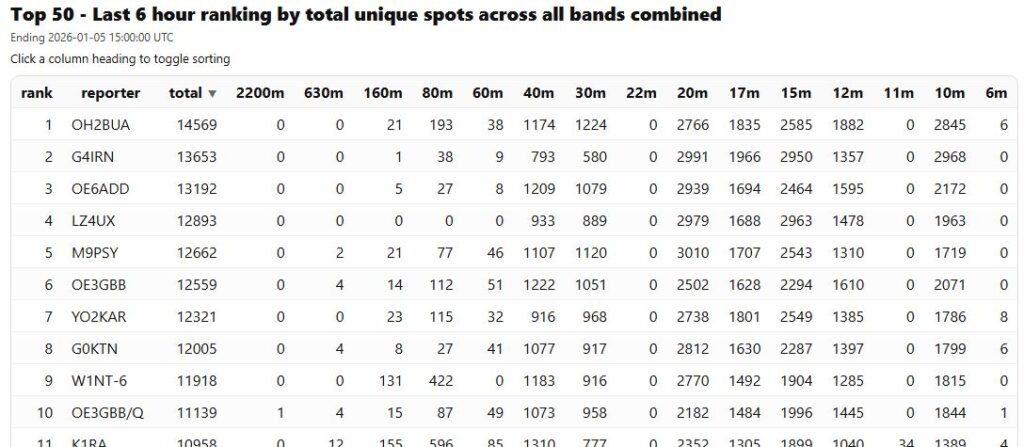
As well as the past 6 hour Top 50 Rankings, which allows one to see how band conditions affect spotting from around the world throughout the day. You can click on any column to sort by ascending or descending order.
The ranking system takes roughly 15 minutes to generate the two Top 50 tables for the 24 hour and 6 hour time periods. This includes downloading the two PSKreporter raw, compressed data files, uncompressing them, performing the searches and tallying and posting the HTML tables to GitHub.
Comments, questions, suggestions welcome at k1ra @ k1ra . us